Файл:Circle cos sin.gif

Содержимое страницы недоступно на других языках.
Материал из Викисловаря

Circle_cos_sin.gif(650 × 390 пкс, размер файла: 517 Кб, MIME-тип: image/gif, закольцованный, 60 фреймов, 6,0 с)

Этот файл из на Викискладе и может использоваться в других проектах. Информация с его страницы описания приведена ниже.

Краткое описание

Описание
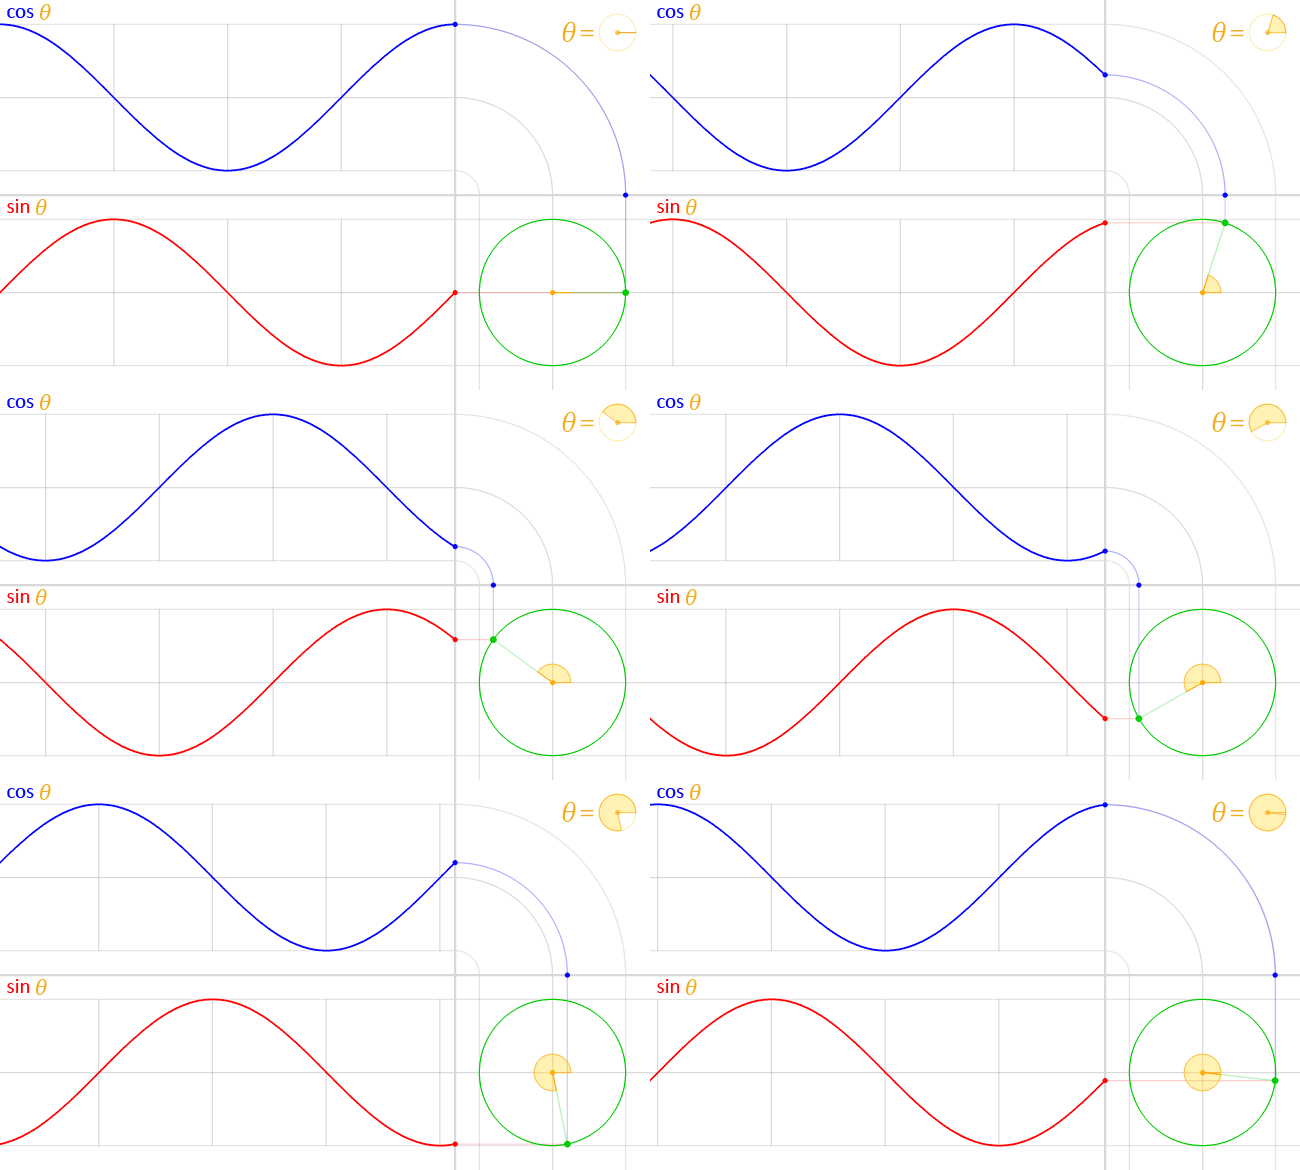
English: We have the unit circle (with radius = 1) in green, placed at the origin at the bottom right.

In the middle of this circle, in yellow, is represented the angle theta (θ). This angle is the amount of counter-clockwise rotation around the circle starting from the right, on the x-axis, as illustrated. An exact copy of this little angle is shown at the top right, as a visual illustration of the definition of θ.

At this angle, and starting at the origin, a (faint) green line is traced outwards, radially. This line intersects the unit circle at a single point, which is the green point spinning around at a constant rate as the angle θ changes, also at a constant rate.

The vertical position of this point is projected straight (along the faint red line) onto the graph on the left of the circle. This results in the red point. The y-coordinate of this red point (the same as the y-coordinate of the green point) is the value of the sine function evaluated at the angle θ, that is:

y coordinate of green point = sin θ

As the angle θ changes, the red point moves up and down, tracing the red graph. This is the graph for the sine function. The faint vertical lines seen passing to the left are marking every quadrant along the circle, that is, at every angle of 90° or π/2 radians. Notice how the sine curve goes from 1, to zero, to -1, then back to zero, at exactly these lines. This is reflecting the fact sin(0) = 0, sin(π/2) =1, sin(π) = 0 and sin(3π/ 2) -1

A similar process is done with the x-coordinate of the green point. However, since the x-coordinate is tilted from the usual convention to plot graphs (where y = f(x), with y vertical and x horizontal), an “untilt” operation was performed in order to repeat the process again in the same orientation, instead of vertically. This was represented by a “bend”, seen on the top right.

Again, the green point is projected upwards (along the faint blue line) and this “bent” projection ends up in the top graph’s rightmost edge, at the blue point. The y-coordinate of this blue point (which, due to the “bend” in the projection, is the same as the x-coordinate of the green point) is the value of the cosine function evaluated at the angle θ, that is:

x coordinate of green point = cos θ
The blue curve traced by this point, as it moves up and down with changing θ, is the the graph of the cosine function. Notice again how it behaves at it crosses every quadrant, reflecting the fact cos(0) = 1, cos(π/2) = 0, cos(π) = -1 and cos(3π/2) = 0.
Дата
Источник Собственная работа
Автор Lucas Vieira
Права
(Повторное использование этого файла)
Public domain Я, владелец авторских прав на это произведение, передаю его в общественное достояние. Это разрешение действует по всему миру.
В некоторых странах это не может быть возможно юридически, в таком случае:
Я даю право кому угодно использовать данное произведение в любых целях без каких-либо условий, за исключением таких условий, которые требуются по закону.

Краткие подписи

Добавьте однострочное описание того, что собой представляет этот файл

Элементы, изображённые на этом файле

изображённый объект

У этого свойства есть некоторое значение без элемента в

image/gif

529 197 байт

5,999999999999995 секунда

390 пиксель

650 пиксель

История файла

Нажмите на дату/время, чтобы увидеть версию файла от того времени.

Дата/времяМиниатюраРазмерыУчастникПримечание
текущий00:32, 24 июня 2014Миниатюра для версии от 00:32, 24 июня 2014650 × 390 (517 Кб)LucasVBReverted to version as of 15:59, 16 March 2014
23:00, 22 июня 2014Миниатюра для версии от 23:00, 22 июня 2014390 × 650 (390 Кб)SteinsplitterBotBot: Image rotated by 90°
15:59, 16 марта 2014Миниатюра для версии от 15:59, 16 марта 2014650 × 390 (517 Кб)LucasVB{{Information |Description ={{en|1=sin & cos}} |Source ={{own}} |Author =LucasVB |Date =2014-03-16 |Permission ={{PD-self}} |other_versions = }} Category:Trigonometry [[Category:Trigonometric funct...

Следующие 2 страницы используют этот файл:

Глобальное использование файла

Данный файл используется в следующих вики: